Projections
Explore the future from today's real numbers.
Projections start from your actual household position — not a blank form — and model income, spending, property and retirement across the decades ahead.
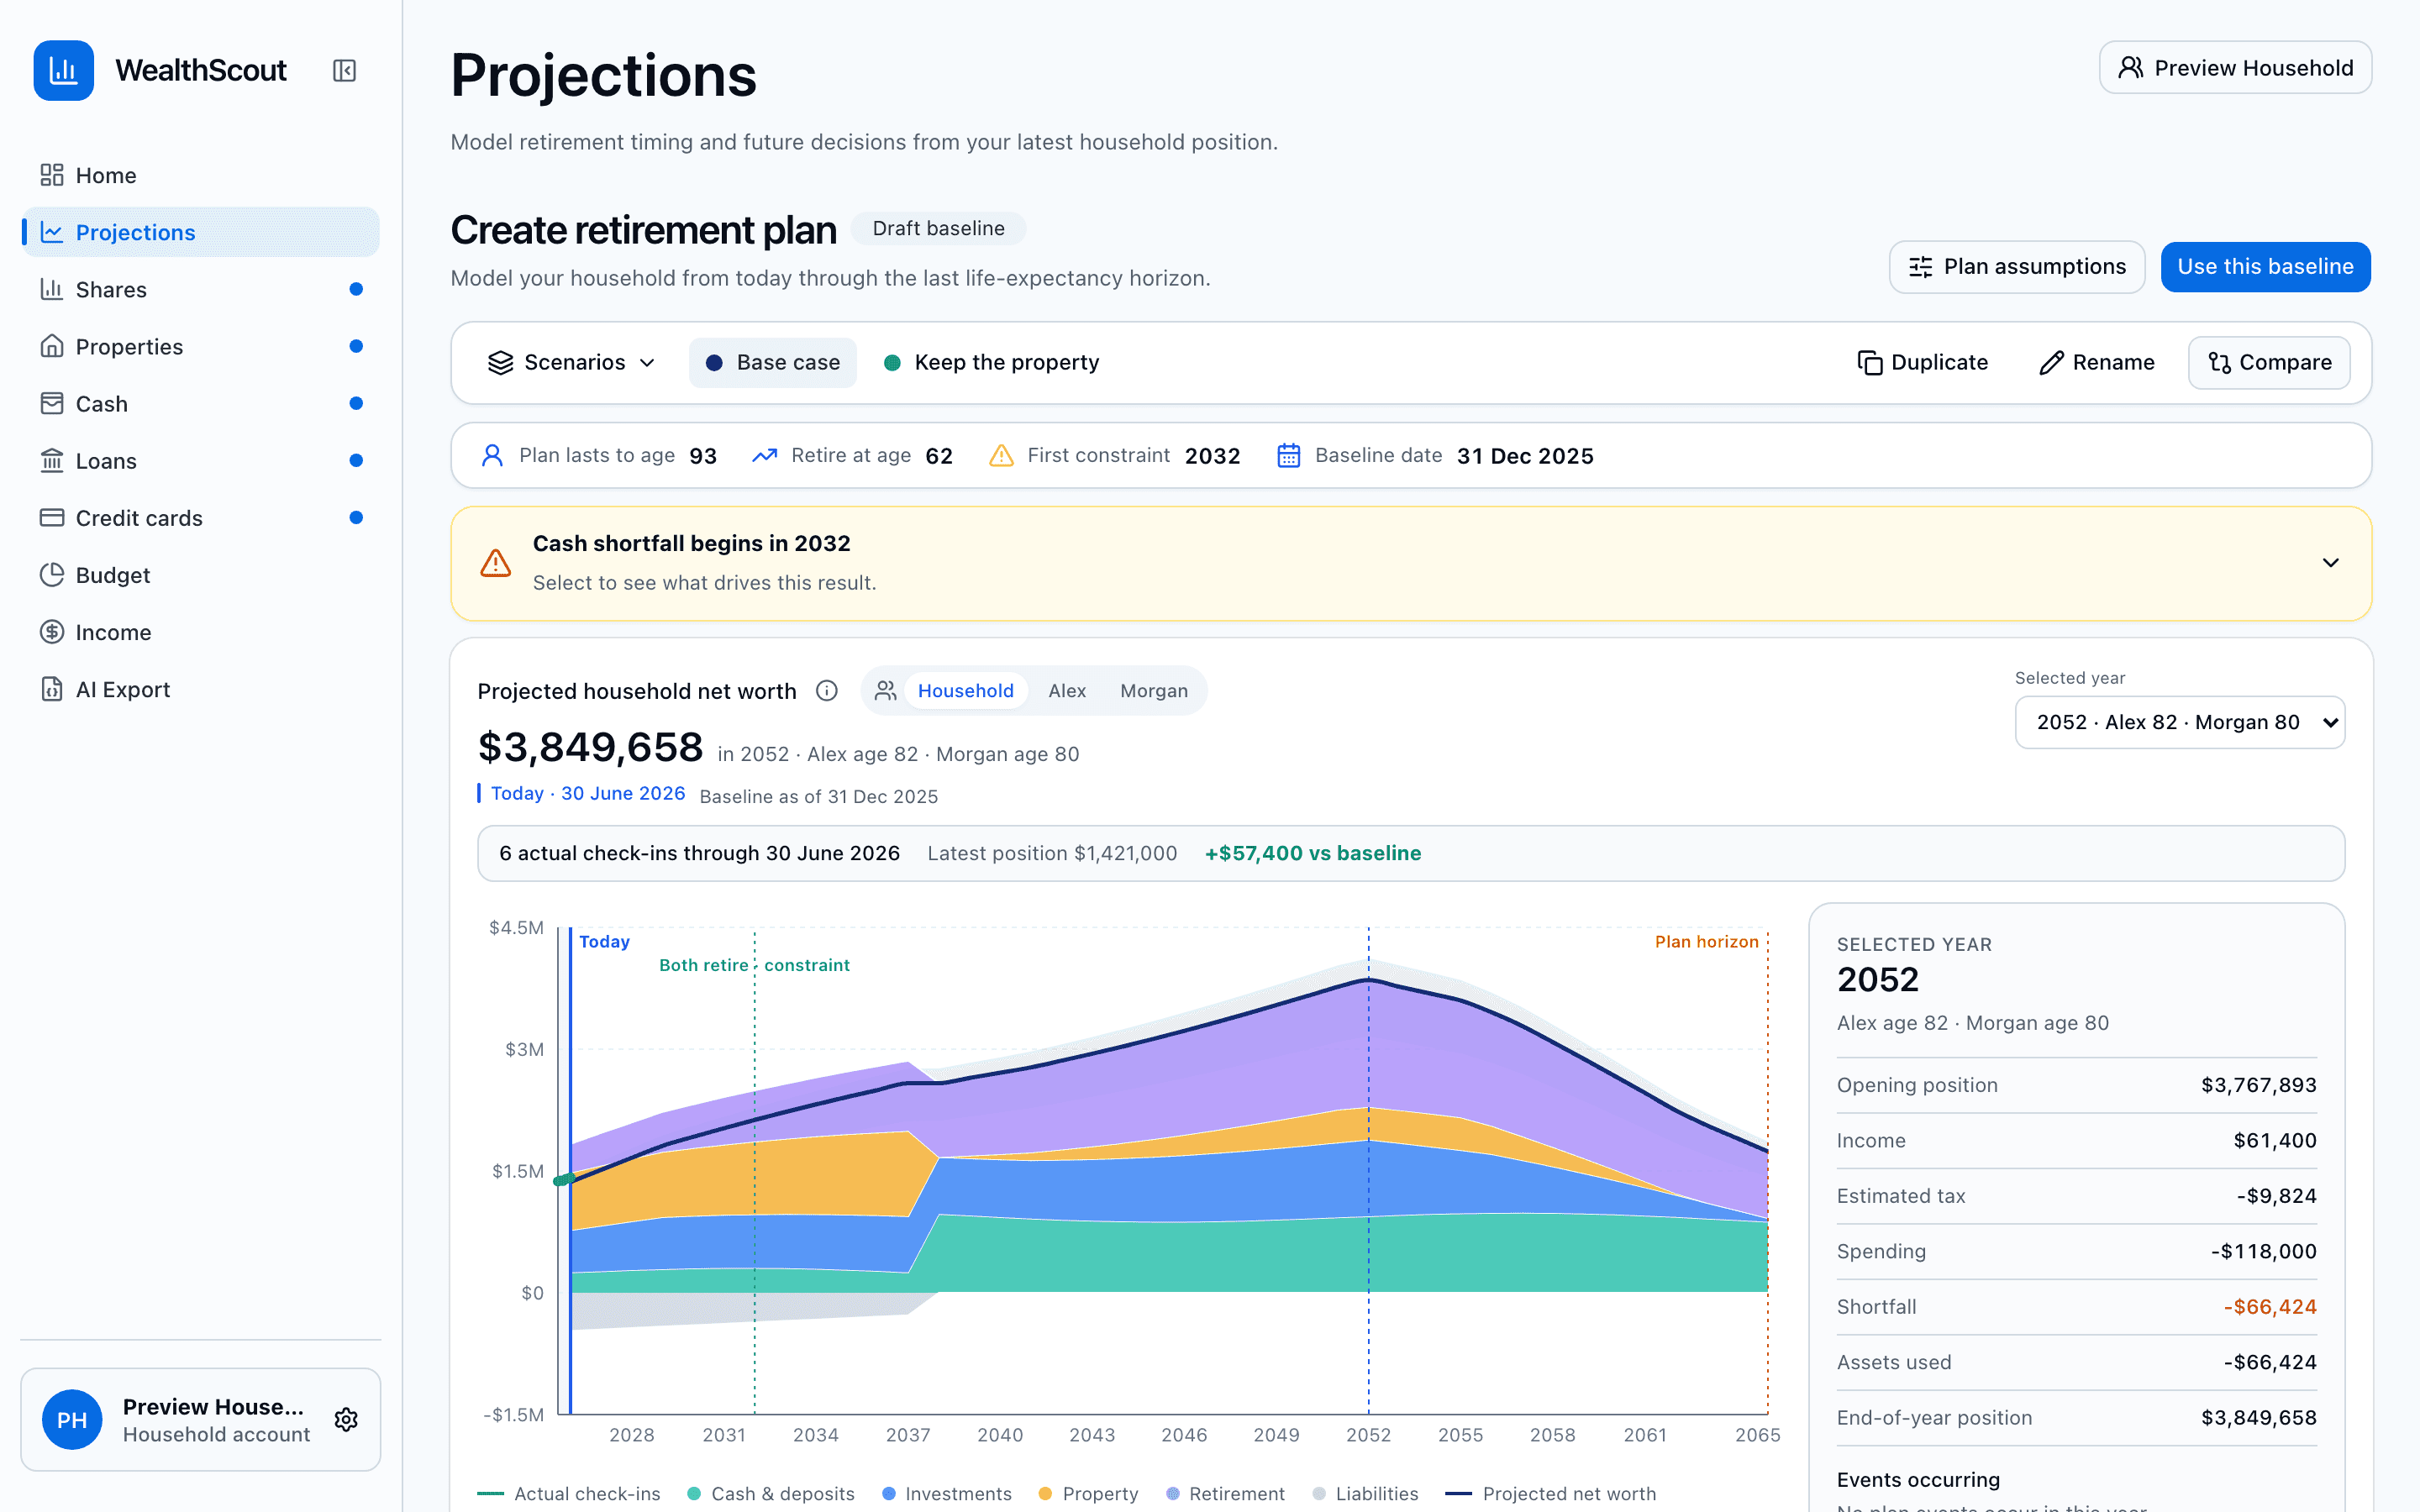
Plan changes
Put life on the timeline.
Add dated changes — a pay rise, reduced hours, a property purchase, an inheritance, new ongoing costs — and watch the long-range picture recalculate. Each change is a card you can edit or remove.
- Income, retirement, property, spending and one-off cash events
- Property purchases with deposit, loan and acquisition costs
- Growth assumptions per change, or tracked to inflation
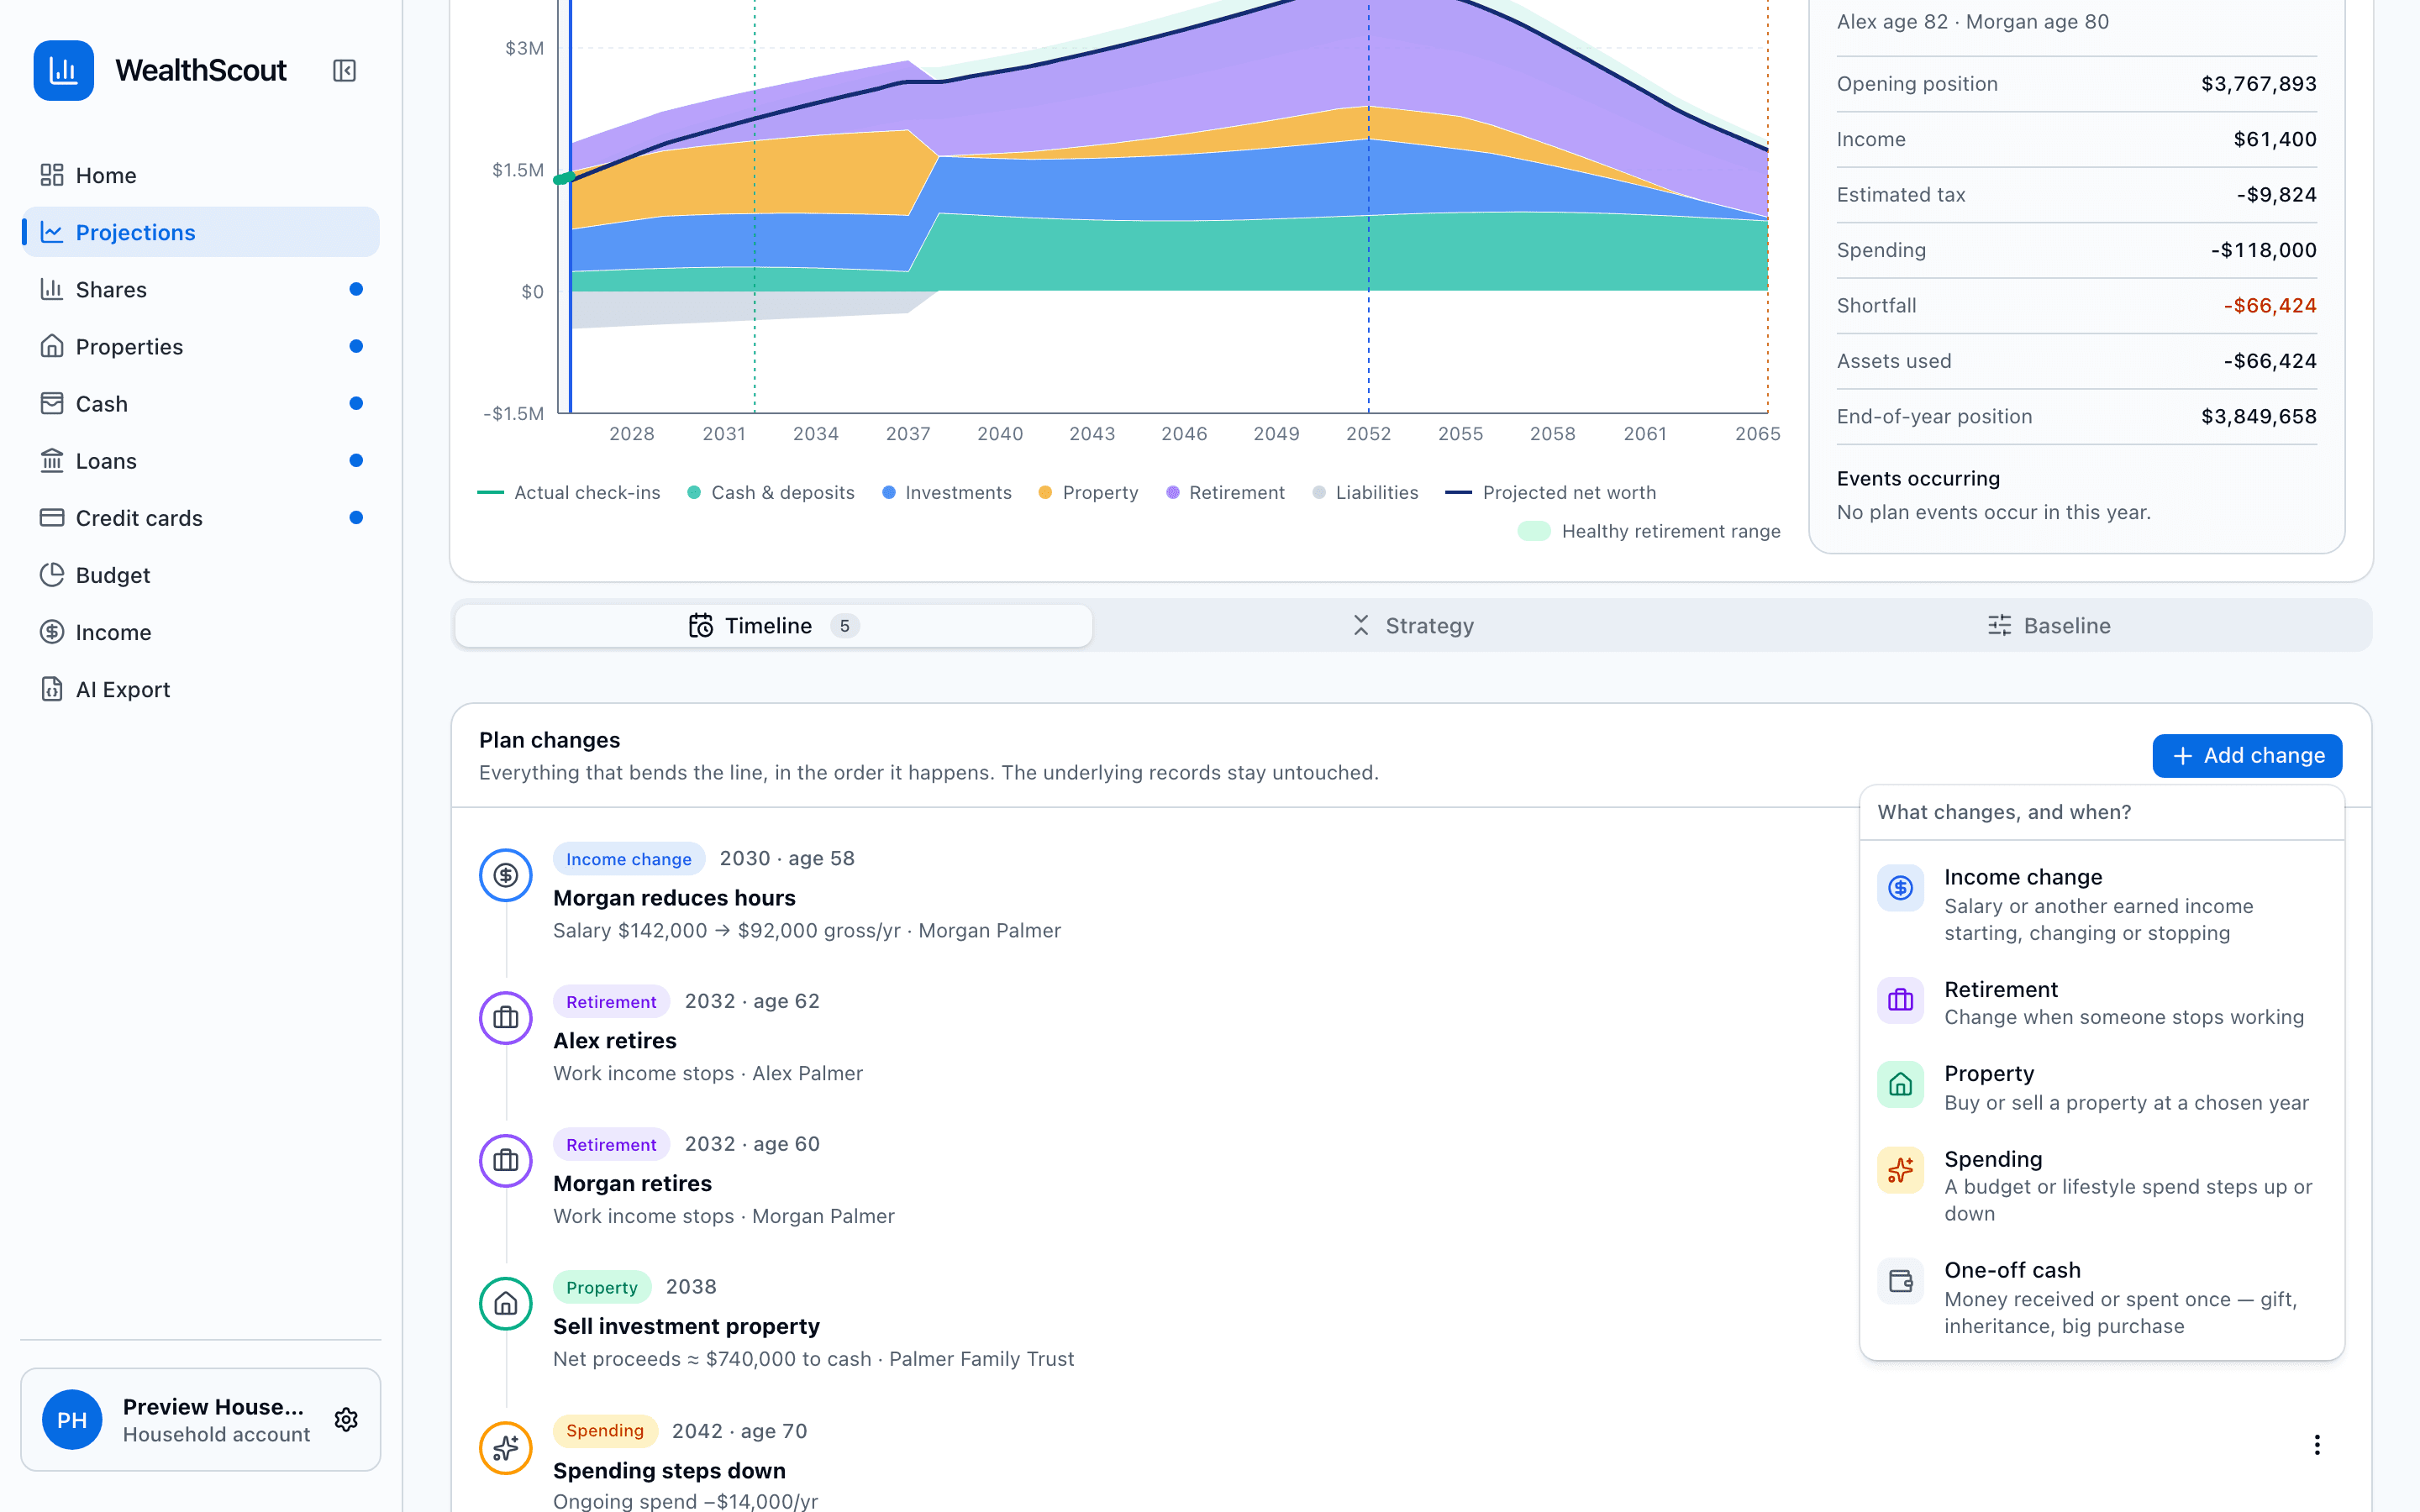
Scenarios
Compare the paths before you pick one.
Duplicate your plan into named scenarios (retire earlier, keep the property, spend less) and overlay them on the same chart to see where the paths diverge and by how much.
- Up to four colour-coded scenarios side by side
- Duplicate, rename and switch between plans instantly
- Constraint warnings show where a plan runs short
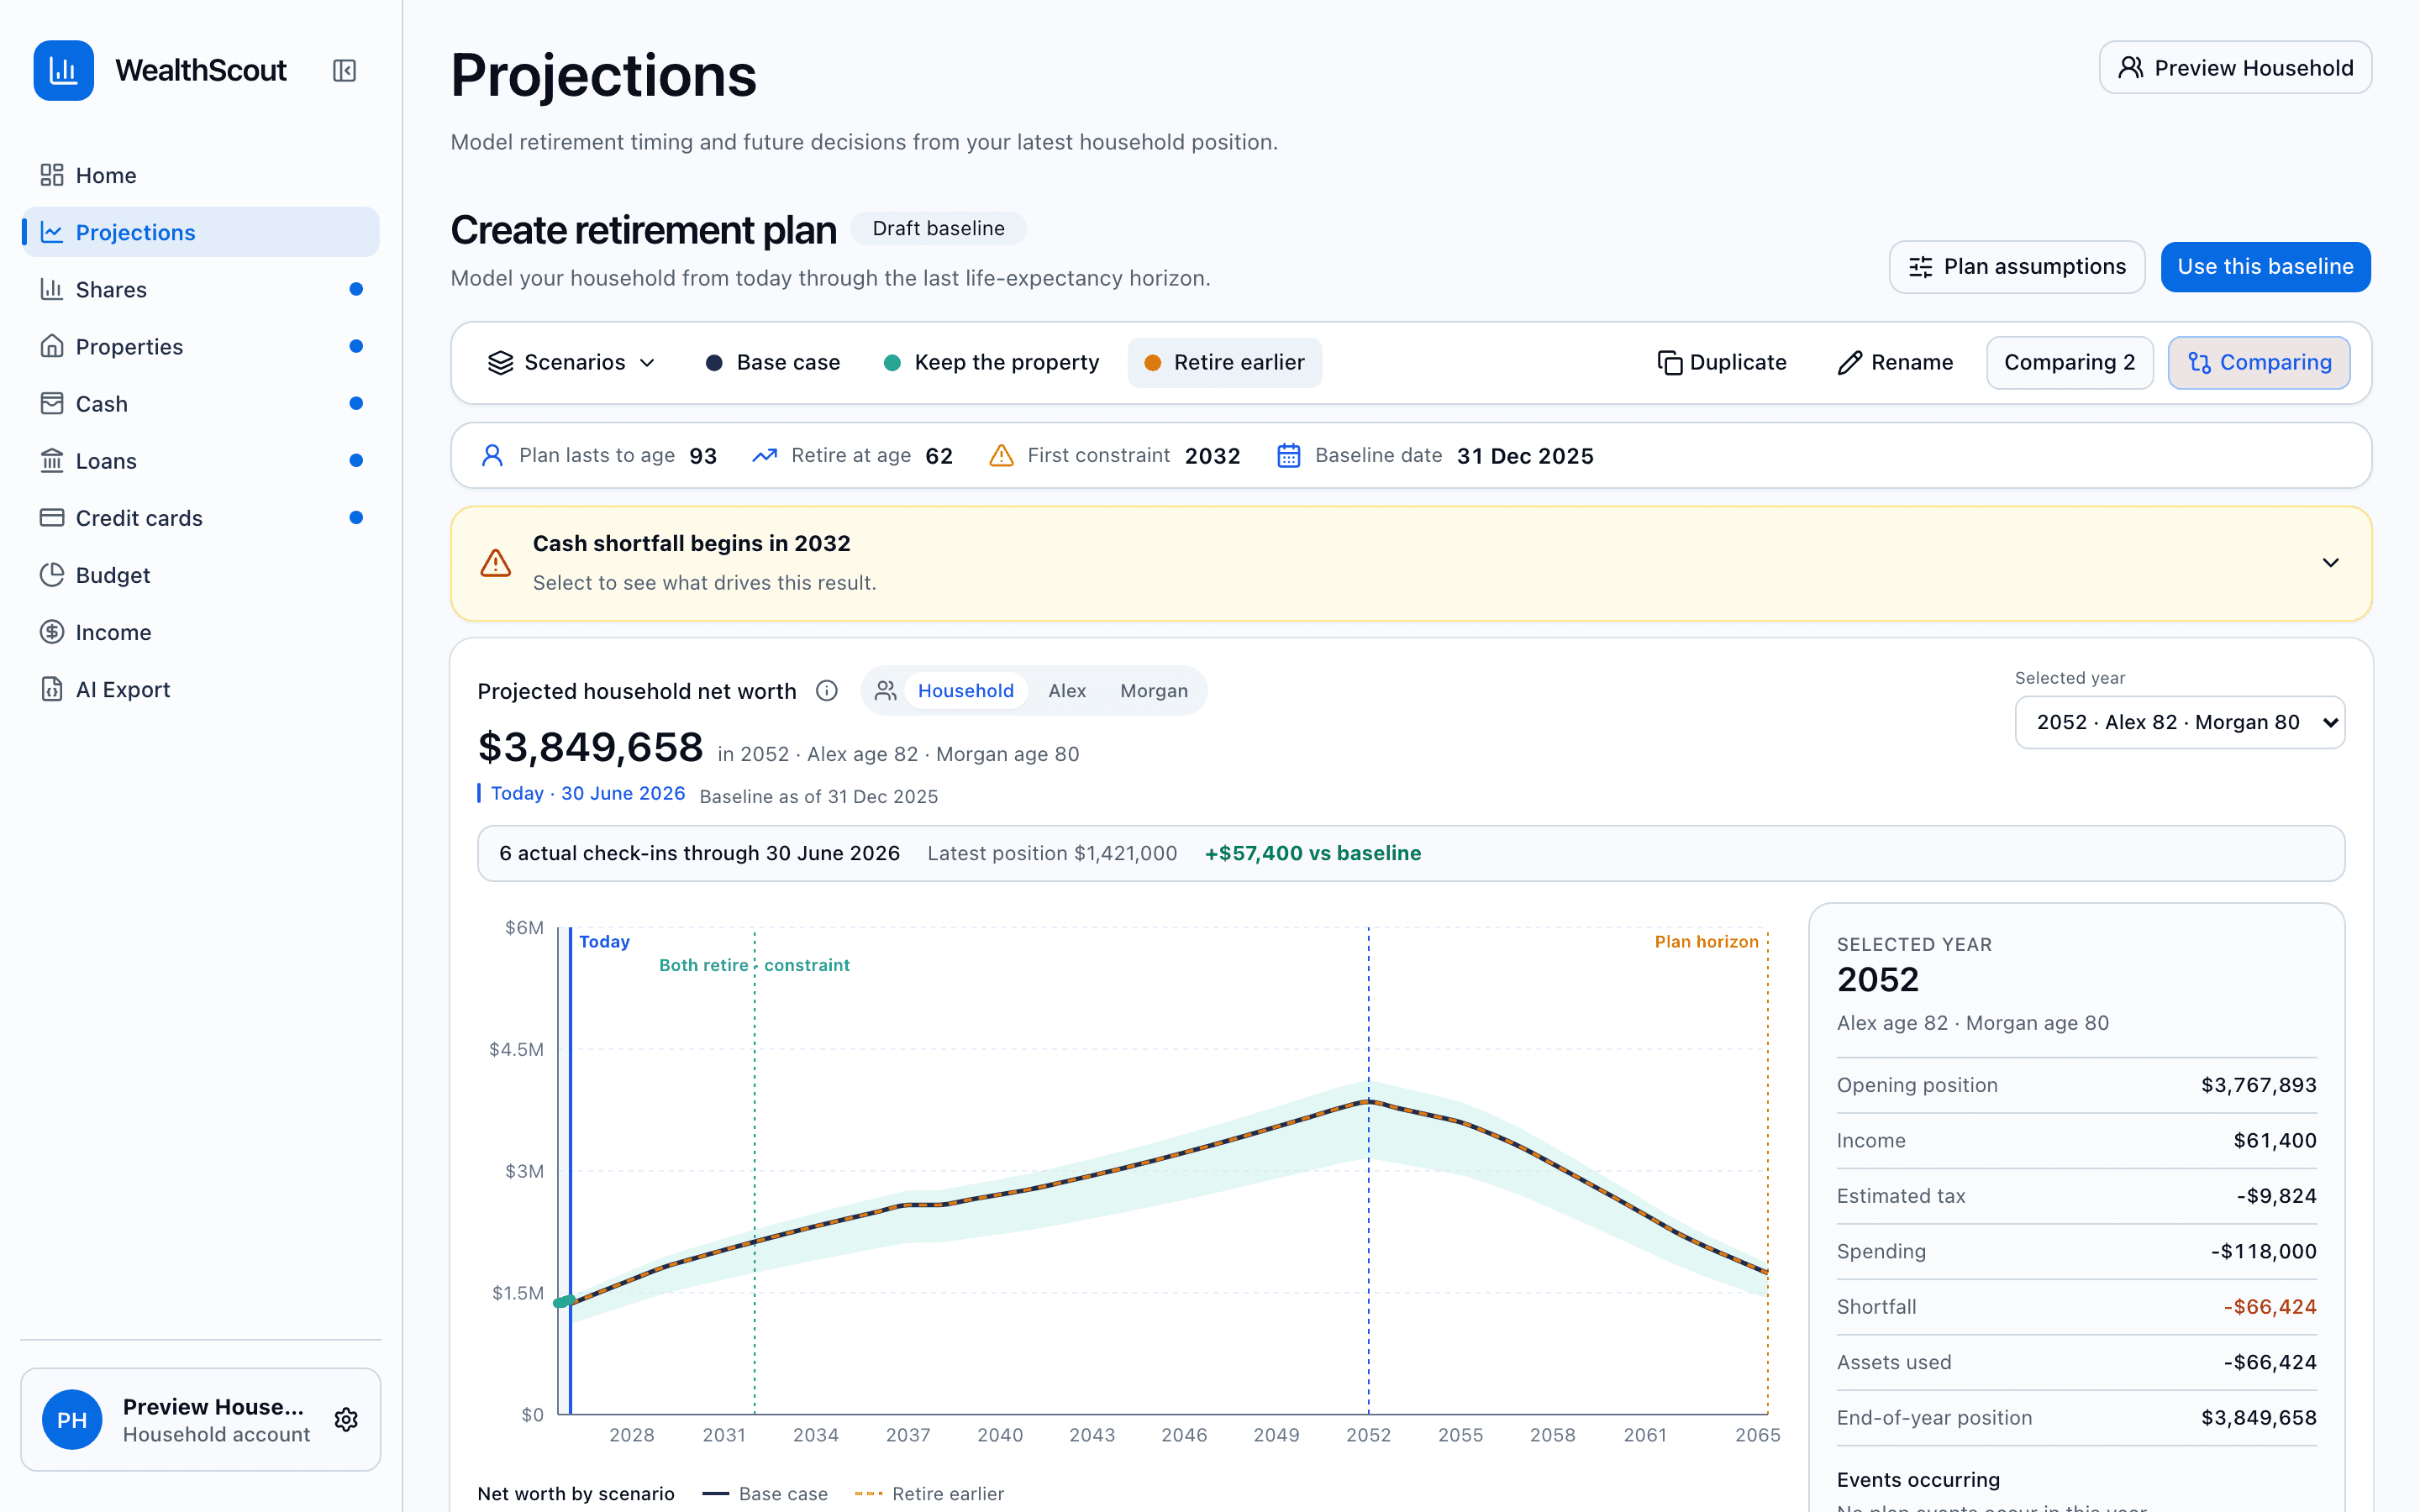
Strategy
Decide which accounts fund retirement, and in what order.
Set the drawdown order: which accounts pay for spending once salaries stop, and where surpluses go while you're still earning. Access rules like preservation ages are respected automatically.
- Reorderable drawdown and surplus allocation
- Retirement account access ages built in
- Optional property sales as a shortfall backstop
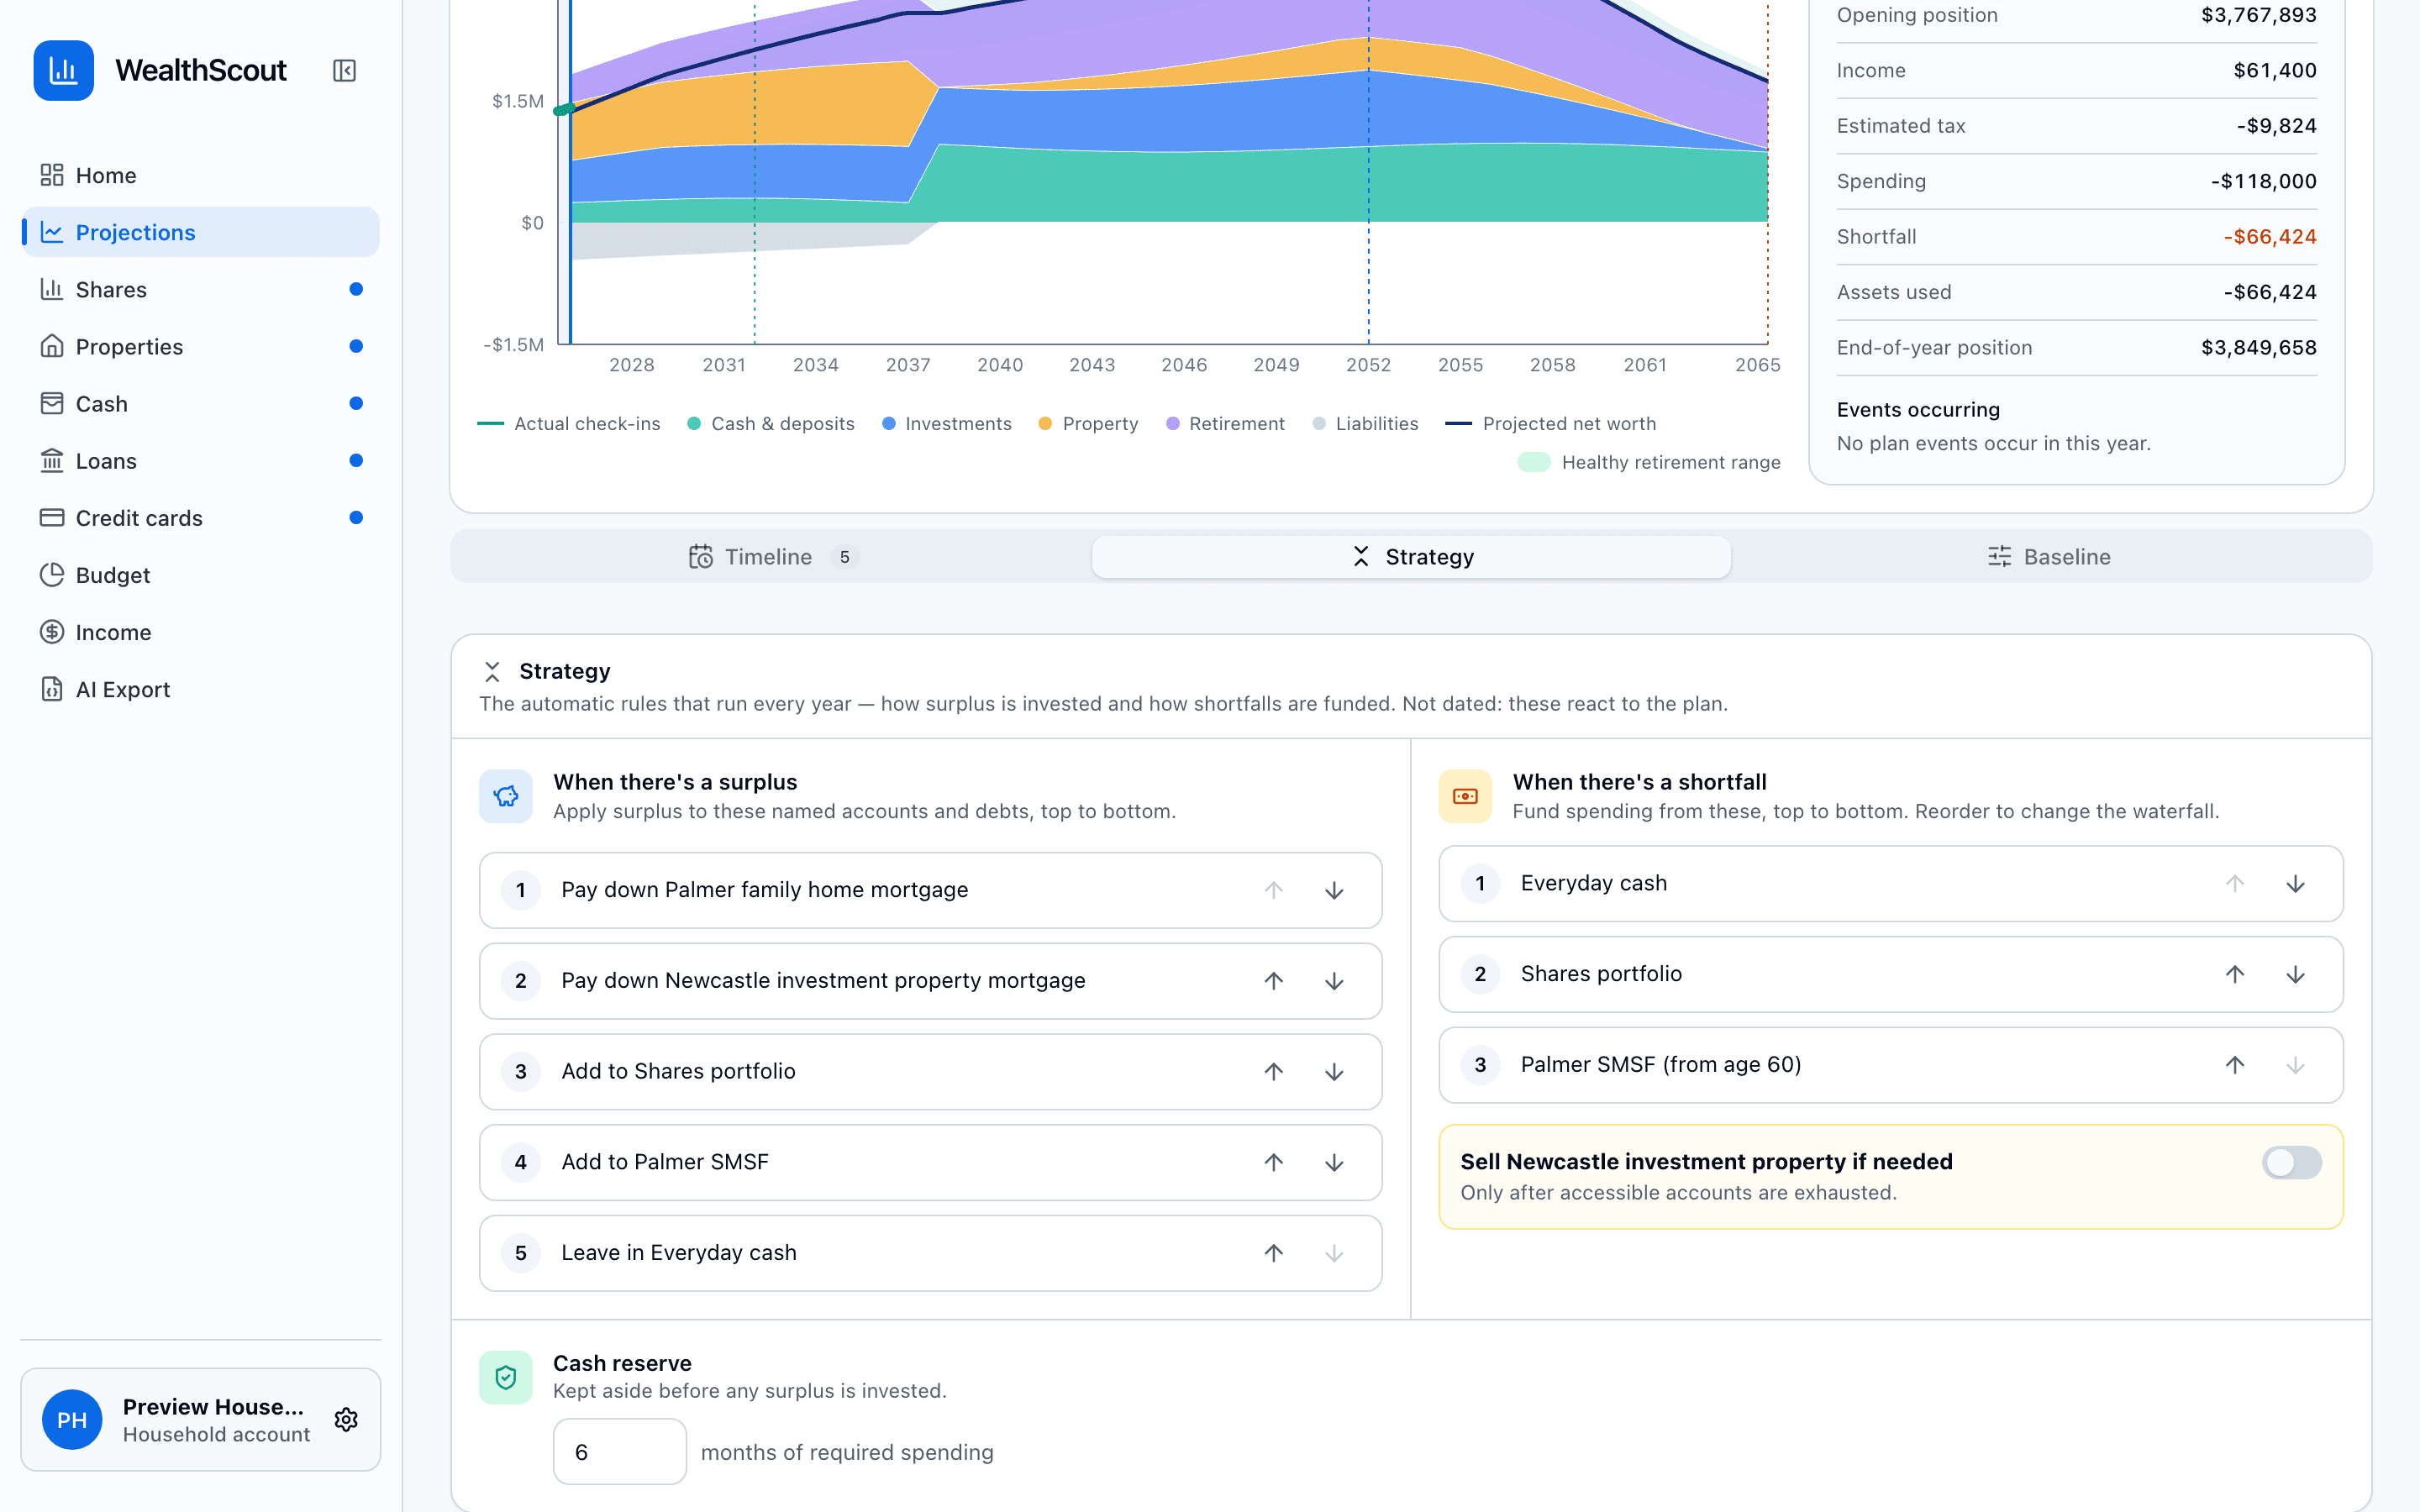
Grounded
A model anchored to your actual check-ins.
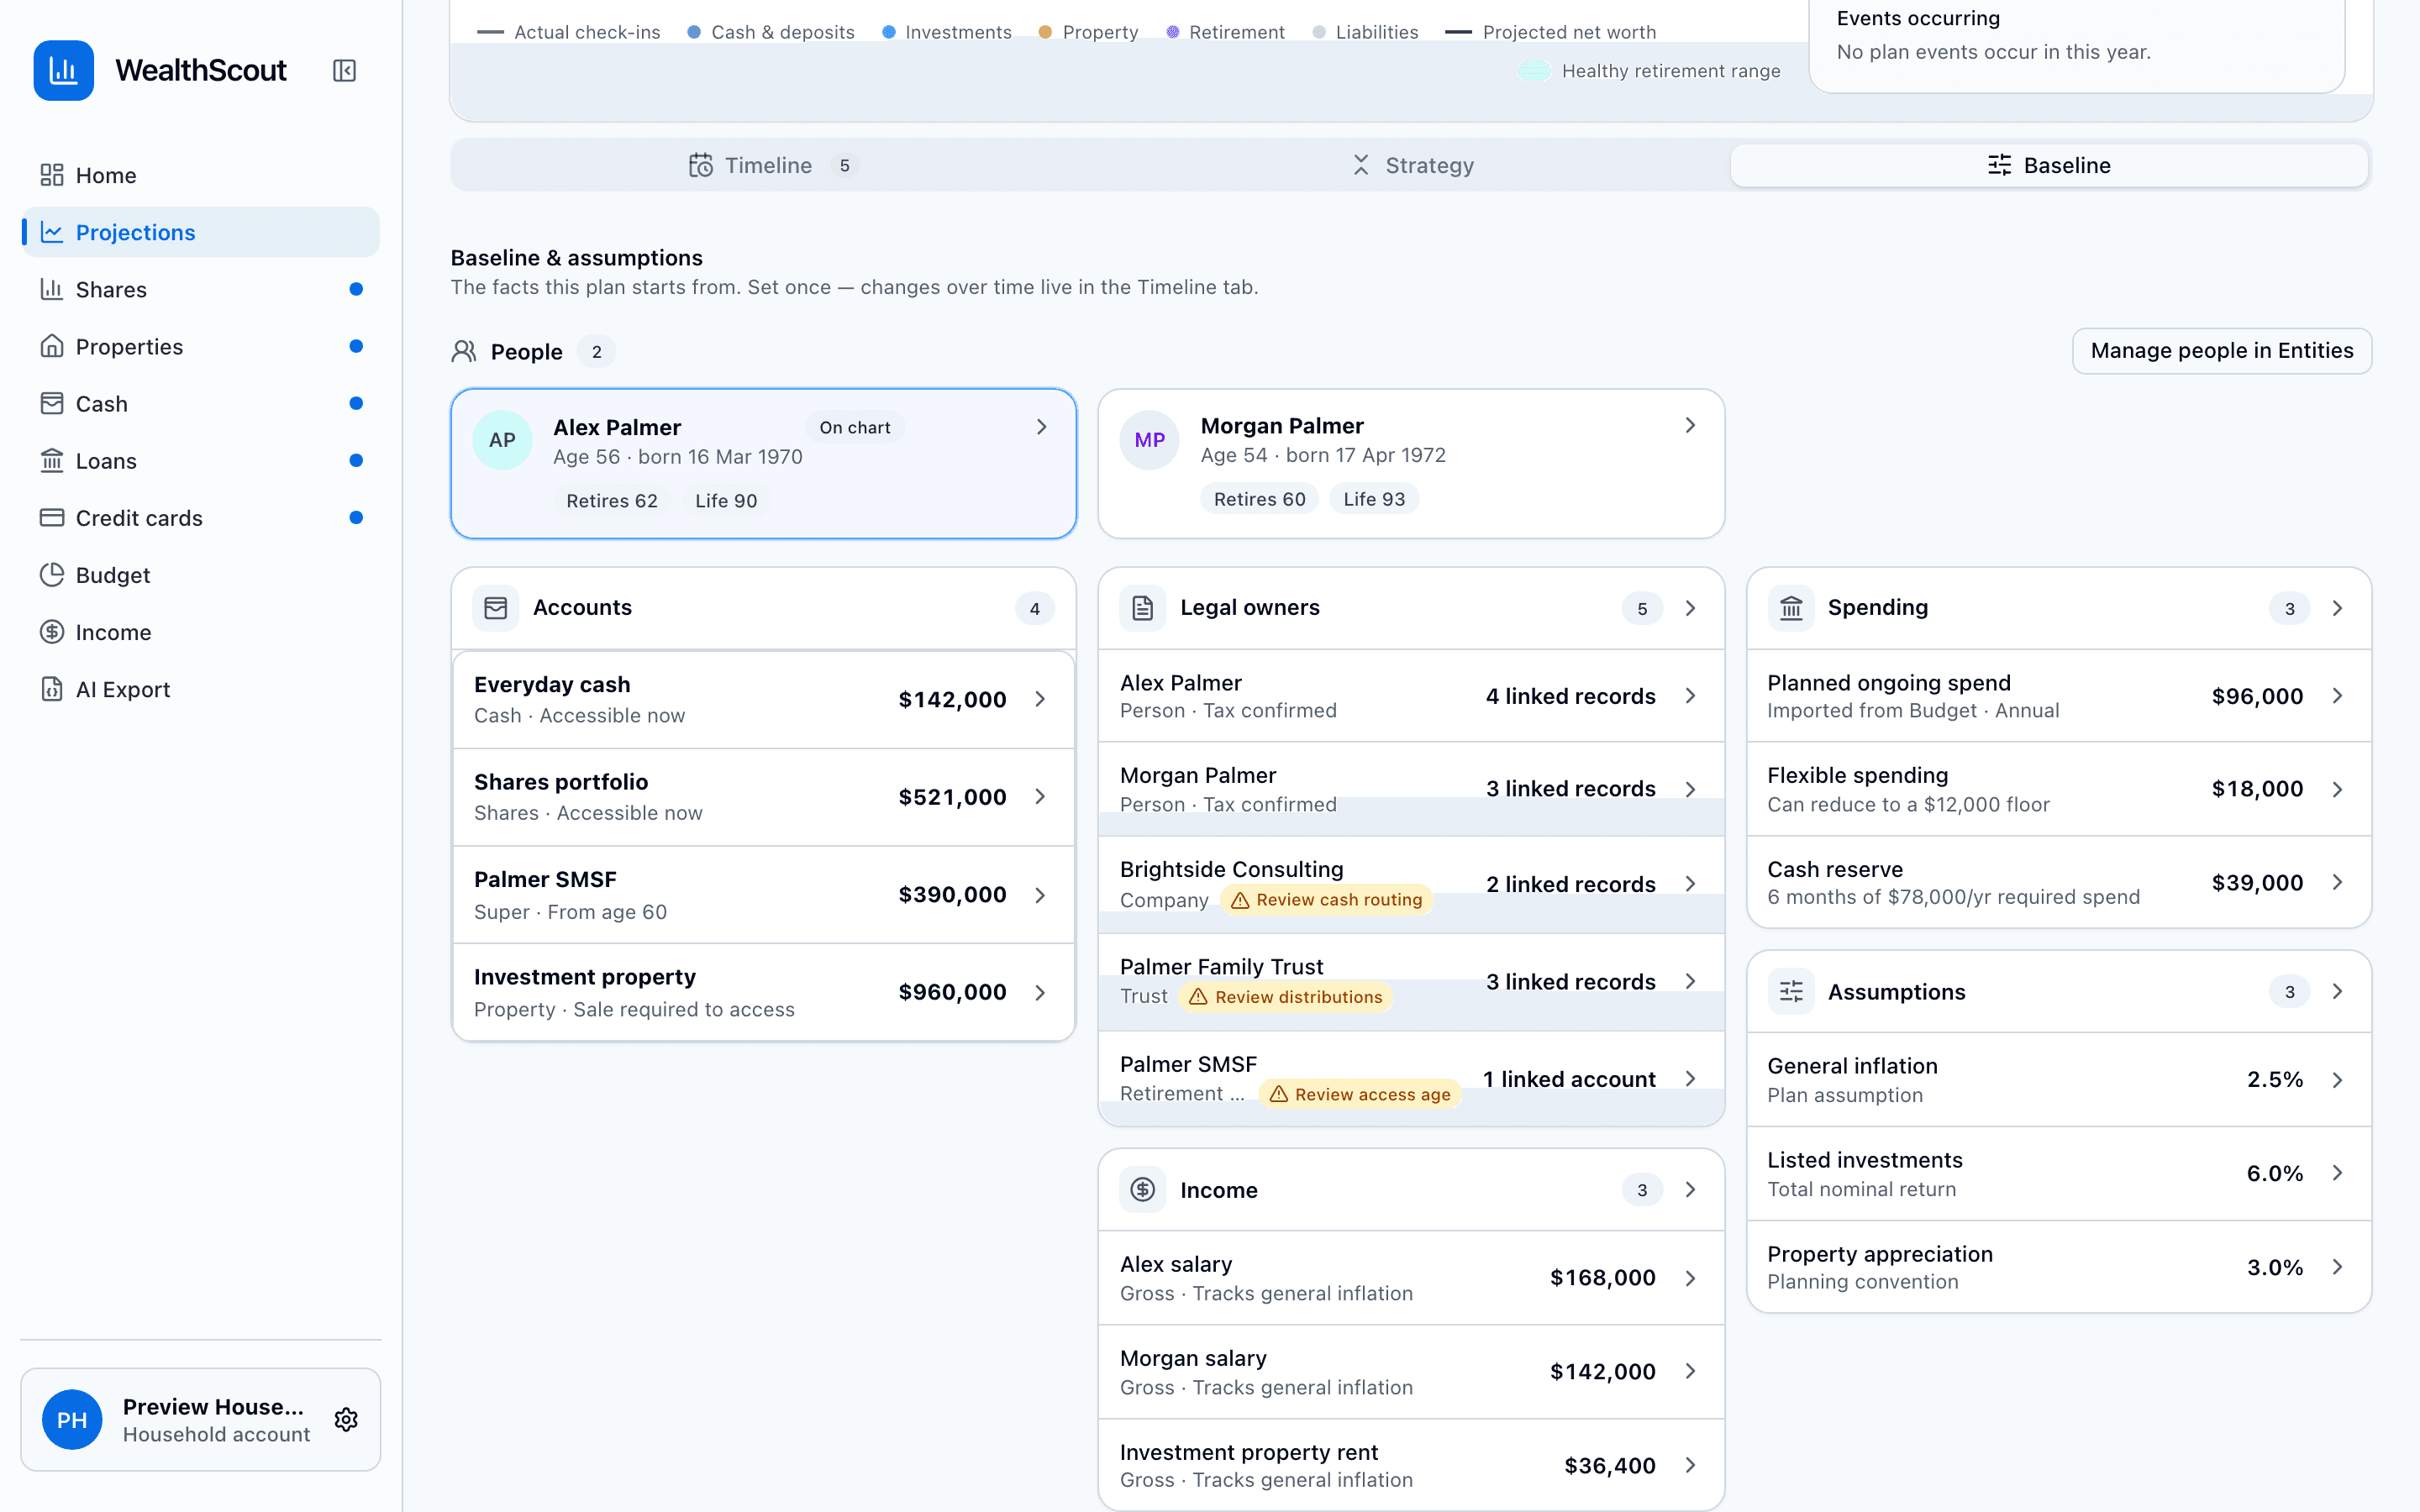
The baseline starts from your latest confirmed household position, and actual check-ins are plotted against the plan, so you always know whether reality is tracking ahead or behind.
- Baseline built from your confirmed positions
- Actual check-ins plotted against the plan
- Transparent, editable assumptions — nothing hidden
Common questions
Where do the starting numbers come from?
From your own household record: the same confirmed positions that drive your net worth and history. There is no separate data entry to keep in sync.
What kinds of future changes can I model?
Income changes (new income, raises, reduced hours), retirement timing, property purchases and sales, ongoing spending changes, and one-off cash events like an inheritance.
Can I compare different plans?
Yes. Duplicate your plan into up to four named scenarios and overlay them on one chart to compare outcomes year by year.
Is this financial advice?
No. Projections are illustrative models driven by your own numbers and assumptions. They help you explore questions to take to a licensed adviser — they don't replace one.
Start planning from your real position.
Build your household record free, then model the decades ahead with numbers you trust.
Projections are illustrative models based on your data and assumptions. They are not forecasts, guarantees, or financial advice.